
Executive Summary
This report analyzes how installment plans and Buy-Now-Pay-Later (BNPL) services have evolved from transitional tools of the subsidy era into core structural components of the U.S. mobile phone market. It synthesizes observed adoption patterns from 2022 to 2025 and provides scenario-based projections through 2026, offering strategic implications for carriers, retailers, manufacturers, and financial partners.
I. Market Size Quantification and Segmentation (2022-2025)
1.1 Definition and Scope
For the purposes of this analysis, the "mobile phone financing market" is defined as the total retail value of U.S. mobile devices purchased through structured financing arrangements—including carrier installment plans, device payment plans, and third-party BNPL services—within a given calendar year. This definition excludes recurring service plan revenue and financing for wearables or accessories alone.
1.2 Market Size Model (Summary)
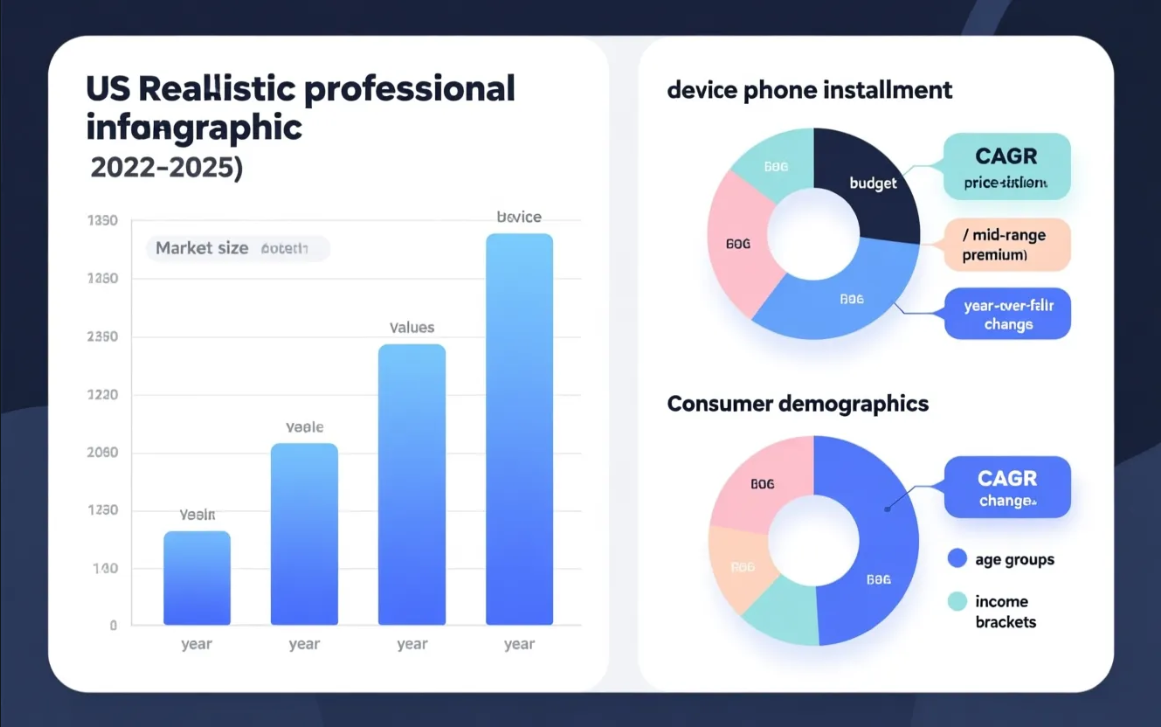
Based on public signals—including U.S. smartphone retail revenues, reported carrier device payment portfolio data, and BNPL adoption trends from market research firms—this report provides modeled estimates placing the U.S. financed device market within the following ranges (by total financed device value):
| Year | Estimated Financed Device Market (USD) | Carrier Installments % | Third-party BNPL % |
| 2022 | $18-$22 billion | 70-78% | 10-18% |
| 2023 | $20-$25 billion | 68-75% | 12-20% |
| 2024 | $22-$28 billion | 65-72% | 15-24% |
| 2025 | $24-$32 billion | 62-70% | 18-28% |
1.3 Model Notes and Assumptions
These figures are modeled estimates, synthesizing information from multiple sources: carrier device financing receivables disclosed in investor filings, BNPL transaction share trends (e.g., from PYMNTS), and smartphone retail revenue trends (e.g., from Statista, Counterpoint Research). Historically, carriers have originated the majority of device financing. While third-party BNPL has expanded, it retained a minority share of financed dollar volume through 2025.
1.4 Segmentation by Device Price Tier and Demographics
-
Premium Devices (>$800): Represent the largest share of financed dollar value despite lower unit volume. Financing penetration among premium buyers is highest, often exceeding 50-70% of purchases, driven by flagship launches (iPhone, Galaxy S/Note/Z series) and trade-in offsets.
-
Mid-Tier Devices ($400-$799): See broad financing adoption (~30-50% of purchases), particularly among younger buyers and those trading up from budget models.
-
Budget Devices (<$400): Exhibit lower financing adoption on a percentage basis (10-30%) but remain significant in scale for value-oriented shoppers using low-cost BNPL options and retailer credit.
-
Demographic Patterns: Younger cohorts (ages 18-34) show higher relative usage of BNPL and third-party checkout options. Middle-income households (annual income $35k-$100k) account for the largest share of financed purchases, combining device needs with limited lump-sum capacity. Urban and suburban markets skew toward carrier installment adoption, while rural consumers rely more on retailer credit and promotional deferred-payment offers.
II. Adoption Rate Analysis Across Major Carriers, Retailers, and Demographic Segments
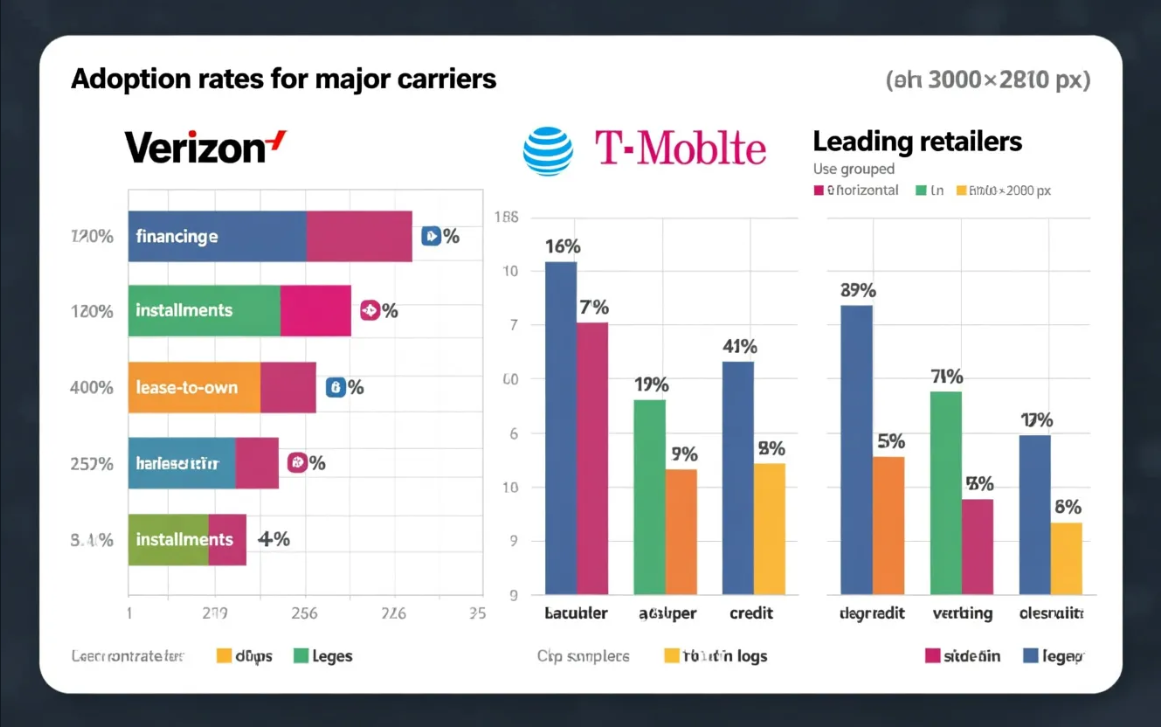
2.1 Carrier Financing Landscape (Verizon, AT&T, T-Mobile)
Carriers continue to control the majority of financed device volume. Based on carrier disclosures and industry reporting, a modeled split of financed device activations suggests rough parity with market share: Verizon accounts for approximately 34-40% of financed-dollar activity, AT&T for 28-34%, and T-Mobile for 26-32%. Differences reflect each carrier's device portfolio, promotional cadence, and trade-in subsidies. Verizon's large postpaid base and high ARPU tend to elevate its financed-dollar share, while T-Mobile's "Un-carrier" promotions and aggressive trade-in programs have driven its unit-financing growth. Carriers' device payment programs (e.g., Verizon Device Payment, AT&T Installment Offers, T-Mobile Equipment Installment Plan) remain the default financing funnel for postpaid upgrades and in-store purchases, limiting third-party penetration within carrier channels.
2.2 Retailer and Manufacturer Financing
-
Apple: Programs like the iPhone Upgrade Program and Apple Financing (via Apple Card Monthly Installments, in partnership with Goldman Sachs) capture a meaningful share of iPhone buyers who prefer direct device financing and programmatic upgrades. Reported participation varies quarterly; Apple's financing flows are concentrated in higher-dollar devices and Apple Store sales.
-
Samsung: Samsung Financing and trade-in programs (often facilitated by Affirm or internal options) are common for flagship Galaxy purchases and promotions tied to carrier activations.
-
Big-Box Retailers: Best Buy, Walmart, and Target offer a mix of store credit, third-party BNPL (Affirm, Klarna), and promotional vendor financing. Best Buy is a notable originator of financed device sales due to its high device volume and Geek Squad financing products.
-
Online Marketplaces: Amazon and other e-tailers increasingly surface BNPL options on product pages. Amazon's past integration with Affirm and periodic installment options boost BNPL device purchases, especially among digital-first shoppers.
2.3 Adoption by Channel (Summary)
-
Carrier Retail and Online Channels: Account for the majority of financed dollars, especially for flagship and mid-tier devices.
-
Manufacturer Direct (Apple/Samsung): Hold an outsized share of premium device financing.
-
Retailers and Marketplaces: Remain important for off-contract or unlocked sales and for value-oriented devices where BNPL is attractive.
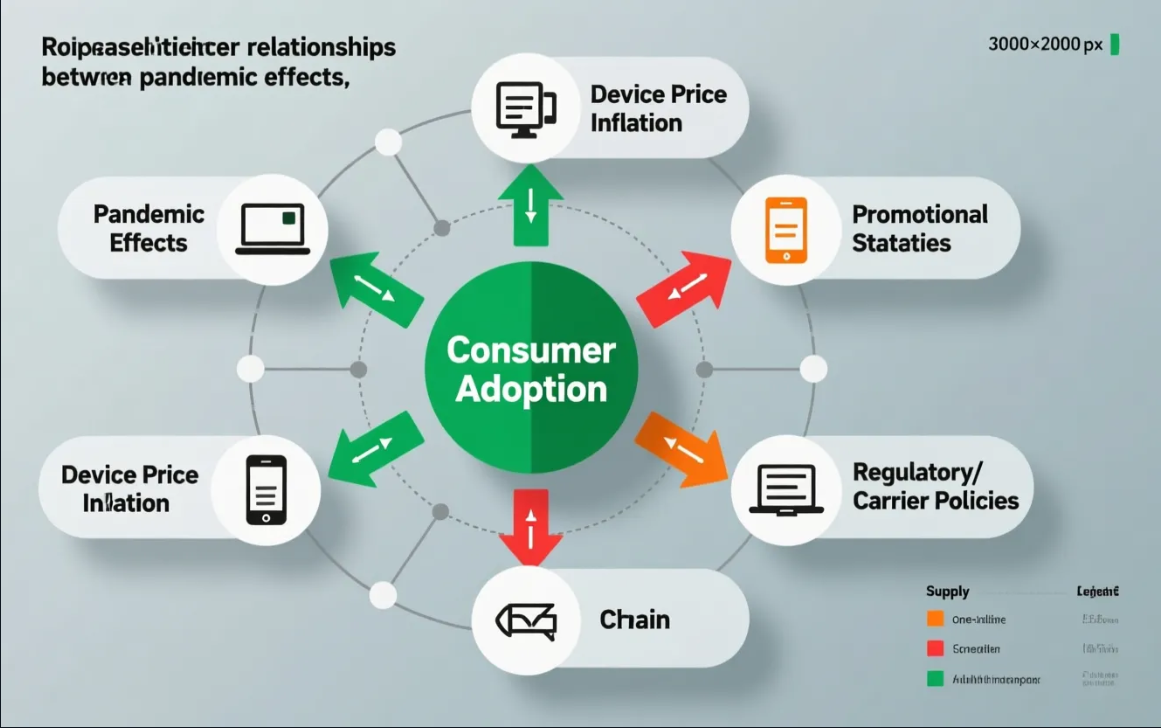
III. Growth Drivers and Barriers Analysis: Pandemic Effects, Inflation, and Promotional Strategies
3.1 Post-Pandemic Consumer Behavior and Macro Drivers
-
Sustained Demand: Remote work, hybrid schooling, and increased mobile-first consumption permanently raised household reliance on smartphones for productivity, education, and entertainment—supporting replacement demand and incentivizing financing when budgets are constrained.
-
Rising Device Prices: Inflation in device average selling prices (ASPs), driven by premium model features and 5G-capable components, increased absolute financed-dollar volumes as buyers opted for monthly payments over upfront cash.
3.2 Promotional Strategies Accelerating Financing Adoption
-
Zero/Low-Interest Carrier Offers: Often coupled with trade-in credits, these lower the effective cost for consumers and steer them toward multi-year payment arrangements.
-
Bundling: Combining device financing with service plan discounts reduces perceived monthly costs and increases loyalty. Carriers have used this extensively to promote device payment programs.
-
Retail BNPL Marketing: Messaging around instant approval, flexible terms, and no-interest windows attracts younger and credit-constrained shoppers who prioritize convenience and speed at checkout.
3.3 Barriers and Risks
-
Regulatory and Compliance Risks: Growing scrutiny of BNPL by U.S. regulators (FTC, CFPB) raises the potential for increased disclosure requirements, underwriting expectations, and consumer protection rules, which could increase origination costs for BNPL providers.
-
Credit Risk and Higher Delinquency: Third-party BNPL providers face elevated charge-off rates for consumer segments using BNPL repeatedly. Carriers historically have lower credit risk exposure because device payments are tied to service accounts with collection capabilities via the billing relationship.
-
Promotional Unsustainability: Heavily discounted or trade-in subsidized offers can compress margins and create volatility in financed receivables if trade-in values or handset supply shift.
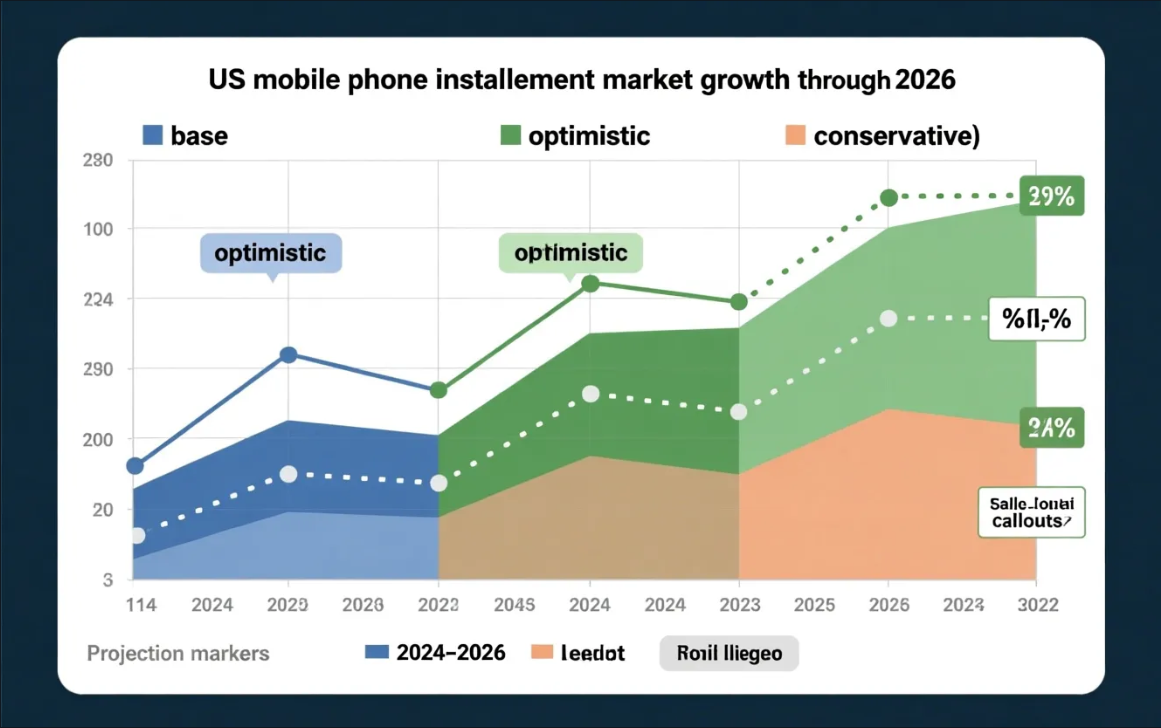
IV. Market Forecast and Trend Projections Through 2026 (Scenario Analysis)
4.1 Projection Framework
Three scenarios reflect variations in macroeconomic conditions, regulatory outcomes, and competitive displacement of carrier-originated financing by third-party BNPL:
-
Base Case (Most Likely): Modest continued growth in financed-dollar volume, driven by rising device ASPs and stable adoption of installment payments. Projected CAGR for total financed device value (2025→2026, continuing prior trend): ~8-12%. Carrier share declines gradually as BNPL integrations deepen.
-
Optimistic Case: Faster BNPL acceptance at major digital retailers and better merchant economics for third-party lenders lead to elevated consumer choice; regulatory clarifications are favorable or neutral. Projected CAGR: ~12-18%. Third-party BNPL captures a greater share (potentially ~30-35% by 2026) of financed dollars, particularly in online and retail channels.
-
Conservative Case: Regulatory tightening, rising interest rates, and higher delinquencies slow consumer financing growth; carriers tighten underwriting and trade-in incentives. Projected CAGR: ~3-6%. Carrier share remains dominant; BNPL growth stalls.
4.2 Emerging Trends and Potential Disruptors
-
Embedded Finance and Point-of-Sale Banking: Deeper partnerships between carriers/retailers and fintechs (Affirm, Klarna, PayPal Pay in 4, Apple/Goldman Sachs) enable frictionless checkout and cross-selling of insurance and accessory bundles.
-
Regulatory Standardization: Clearer consumer credit treatment for BNPL could level the playing field with card and installment lenders but may raise compliance costs.
-
Device Lifecycle Services: Trade-in marketplaces and Device-as-a-Service (DaaS) subscription models could shift financed dollars from one-time purchases to recurring device subscriptions, impacting receivable profiles and churn economics.
V. Actionable Implications for Providers
-
Carriers: Preserve device-financing primacy by integrating flexible, BNPL-like short-term options, enhancing trade-in valuation transparency, and leveraging the billing relationship to manage credit risk.
-
Retailers & Marketplaces: Differentiate with frictionless embedded BNPL offers, loyalty integration, and bundled warranties that raise perceived value while protecting margins.
-
Manufacturers: Use manufacturer financing to lock premium-device buyers into upgrade and accessory ecosystems; explore DaaS pilots to monetize lifecycle and services revenue.
VI. Conclusion
Installment plans and BNPL have become structural elements of U.S. mobile phone commerce. From 2022 to 2025, the financed device market expanded as device ASPs rose and consumers sought cash-flow flexibility. Carriers continue to originate the majority of financed dollars, but third-party BNPL made inroads—especially in retail and online channels and among younger buyers. The market through 2026 will be shaped by how regulators treat BNPL, whether BNPL providers can sustainably manage credit risk, and how carriers and manufacturers adapt through bundling, subscriptions, and embedded-finance partnerships.
Strategic Takeaway: Stakeholders should prepare for a "finance-first" purchase journey by streamlining checkout, clarifying trade-in and interest disclosures, and testing subscription and DaaS models. Those who align device marketing, trade-in mechanics, and financing options will capture an outsized advantage in upgrade cycles as device prices continue to rise.
VII. Selected References and Further Reading
-
Carrier Investor Relations Pages (Verizon, AT&T, T-Mobile)
-
Industry Analysis Hubs (Counterpoint Research, Statista)
-
BNPL Coverage and Research (PYMNTS, CFPB, FTC)
Specific sources include, but are not limited to:
Verizon Investor Relations, AT&T Investor Relations, T-Mobile Investor Relations, CFPB (Consumer Financial Protection Bureau), FTC (Federal Trade Commission), PYMNTS.com, Statista.